Node usage guide
This section describes how to search, add, delete, modify, and view node properties.
Search node
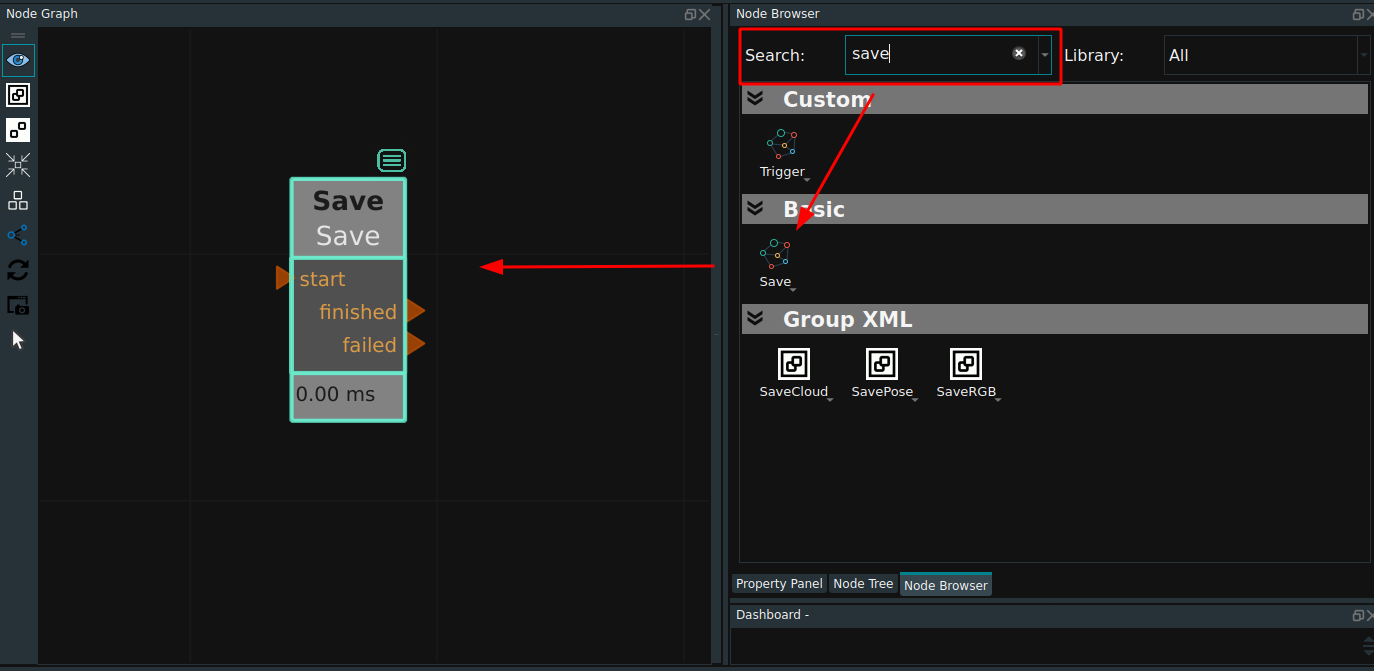
Enter keywords in the search box of the Node Browser (red box in the picture below) to filter the required nodes.
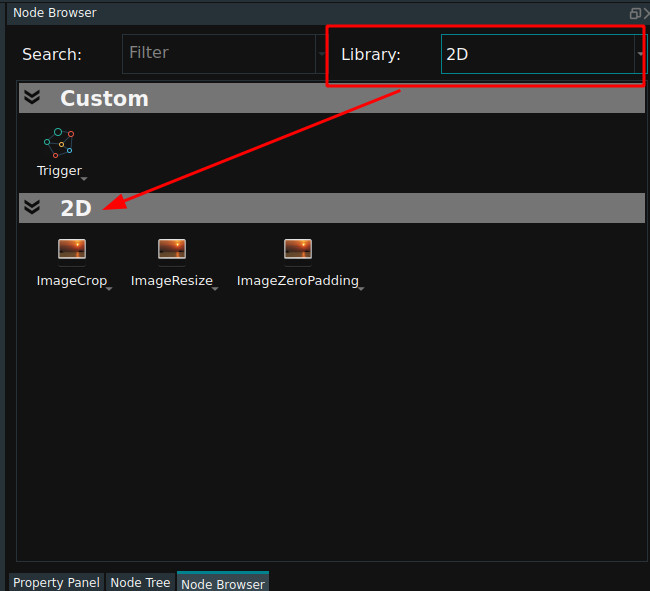
Select the specified node library in the node list (red box in the figure below) and filter out the required nodes.
View the node online documentation
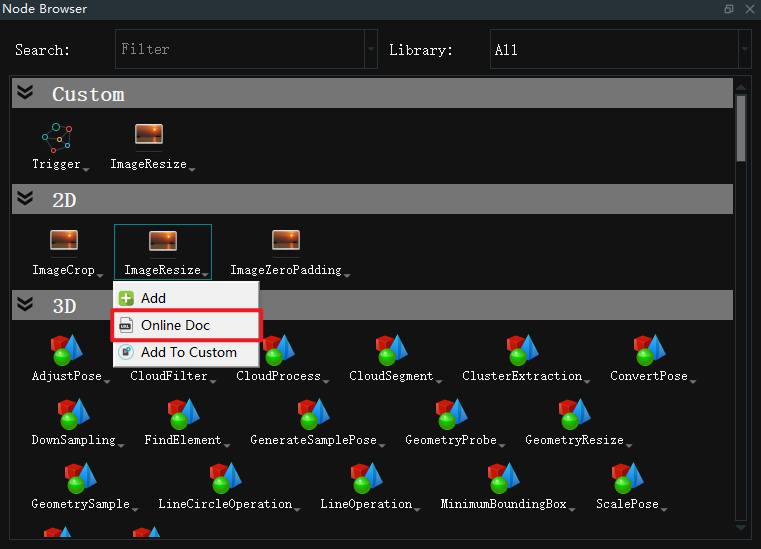
Right-click node and select Online Doc to navigate to the corresponding node description section in the RVS online documentation.
Add node to custom
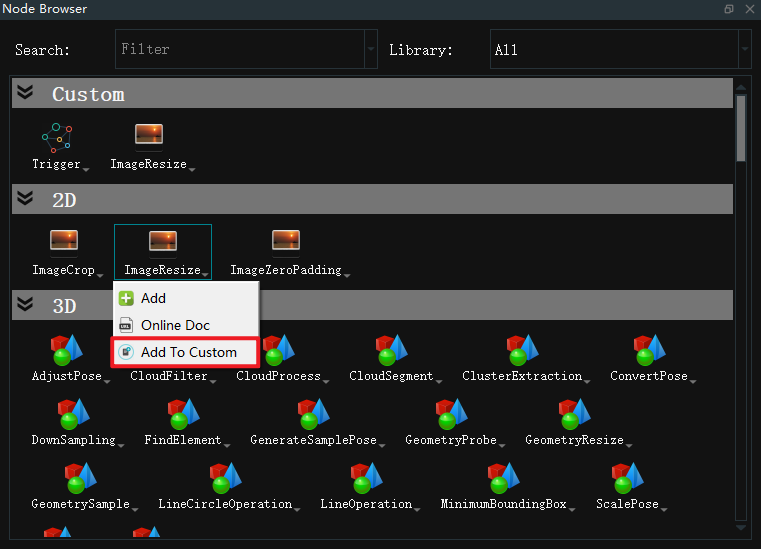
Right-click node and select Add To Custom to add common node to the custom library.
Adds a node to the node graph
Method 1:Select the node you want to use in the node browser, use the left mouse button to long press the node entry and drag it to the node graph to complete the addition.
Method 2:Find the node entry, Double click left mouse button to complete the addition.Only resource nodes can use this method.
Method 3:Right-click node and select Add to complete the addition.
Note:If you need to add an node to a Group in the node graph, you can only drag the desired node into the Group by dragging the node as described above.

Delete node
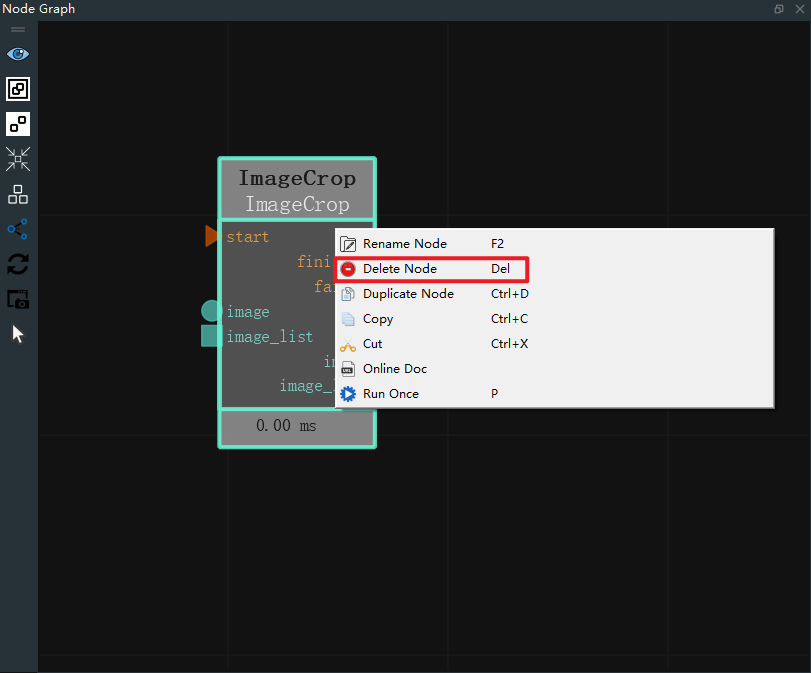
Step 1:Right-click to delete the node, pop up the menu bar, select `Delete Node’ or shortcut key (Delete).
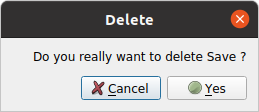
Step 2:Pop-up “Delete” window, click Yes to delete. Click Cancel to cancel the delete operation.
Modify Node
Modifying node include renaming, selecting a type, and modifying parameter values.
Rename Node
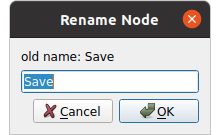
Method 1:Select the node you want to rename and hold down the keyboard F2.
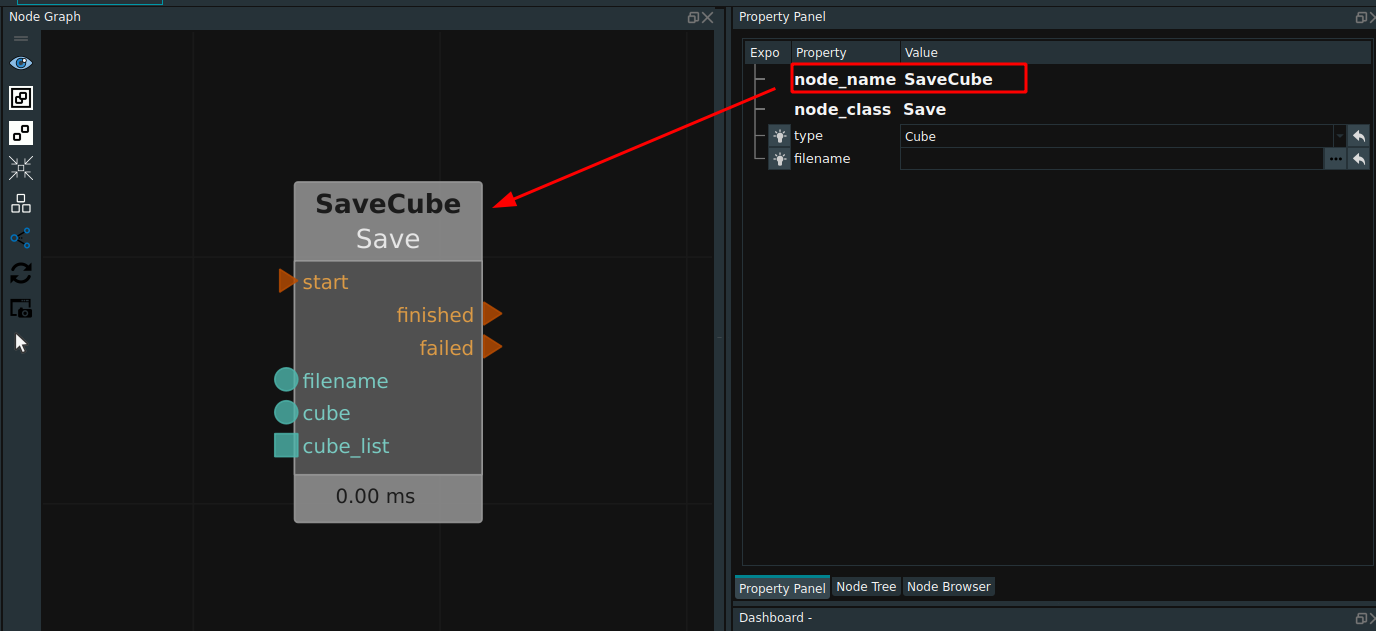
Method 2:Select the node you want to rename, double-click the node name property in the property panel, and then press Enter to confirm.
Select Type
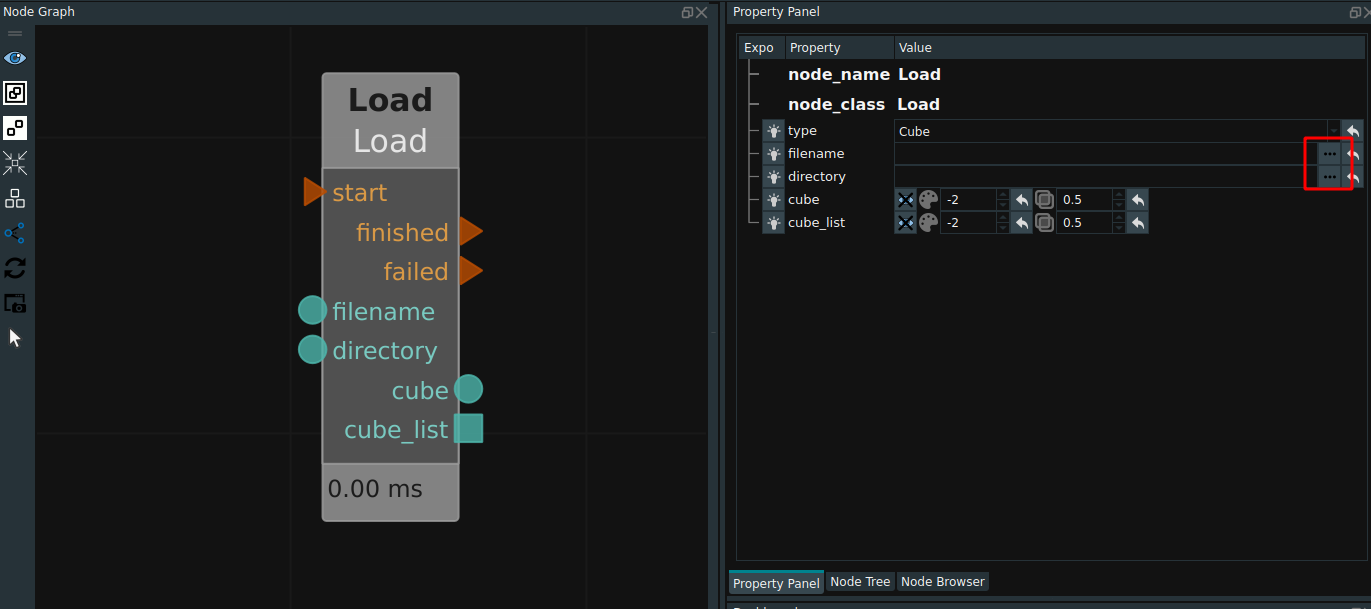
Use the left mouse button to click the node in the node diagram, and the corresponding node properties will be exposed in the properties panel.For node with multiple types, the type must be selected before use, such as Load node. When the type of Cube is selected, the properties of Cube can be modified in the property panel, and the corresponding data input and output ports will be displayed in the node graph.

Modify property values
For an node that has a “directory/file” attribute, click at that attribute![]() , the Folder/File selection dialog box is displayed.
, the Folder/File selection dialog box is displayed.
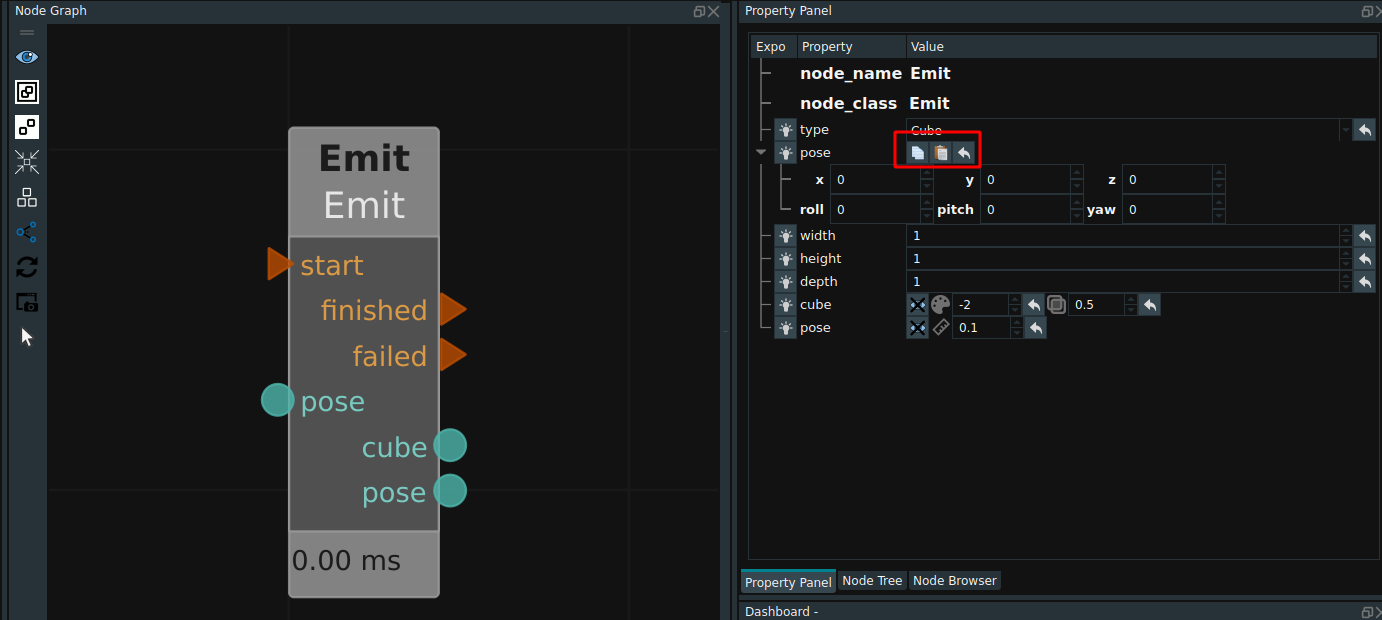
For node with pose property, you can choose whether to copy/paste/reset from the menu at this property.
Connect the note
The purpose of connection nodes in RVS software is to connect different nodes in a certain logical order and data flow relationship to form a complete application flow diagram. Join nodes can realize data transfer and control transfer between nodes, so as to realize complex functions and logic.
In RVS software, there are two types of connection nodes: control connection and data connection.
Control connection:It refers to connecting the control port of one node to the control port of another node, so as to realize the control structure of the flow chart such as branches and loops.Data connection:It refers to connecting the output port of one node to the input port of another node, so as to realize the transmission and processing of data.
Connection control signal
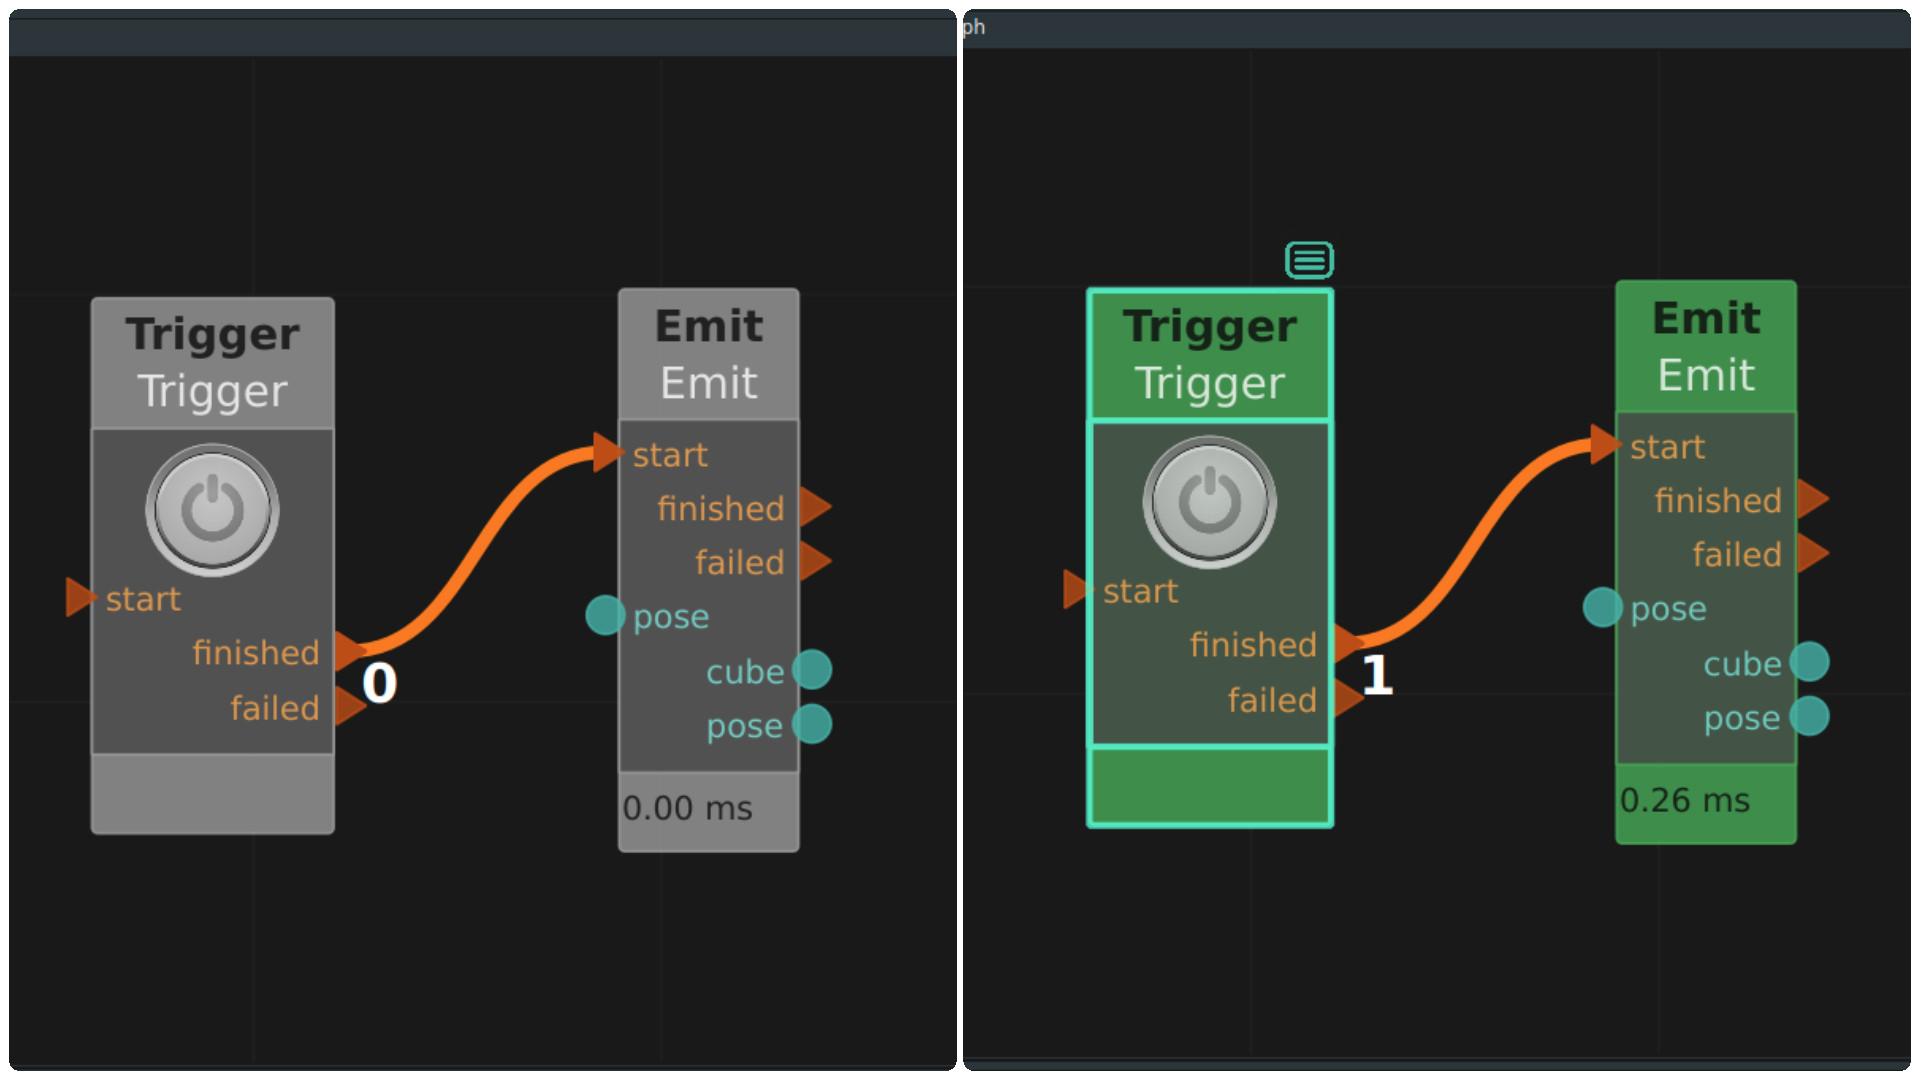
The control port connection between nodes can realize the control structure of flow chart such as branch and loop.The orange ▶ is the control signal port. After the start port on the left is triggered, the node will automatically run once.
After the node is finished, the finished port or failed port on the right sends a trigger signal.
The Trigger and Emit (cube) nodes are shown in the following picture. When the Trigger node is triggered, the Emit (cube) node will be triggered.
Notes:Control signal ports do not distinguish between types and categories and can be connected to each other.
Connection data signal
Click an node port with the left mouse button. Do not release the mouse. Drag the mouse to the next port and release the mouse to complete a connection.
Notes:The output port of the node can export multiple lines connected to other ports, but its input port can only accept one input. node ports cannot be self-connected.
Node port ICONS are ▶ ■ ● three categories, as shown below.
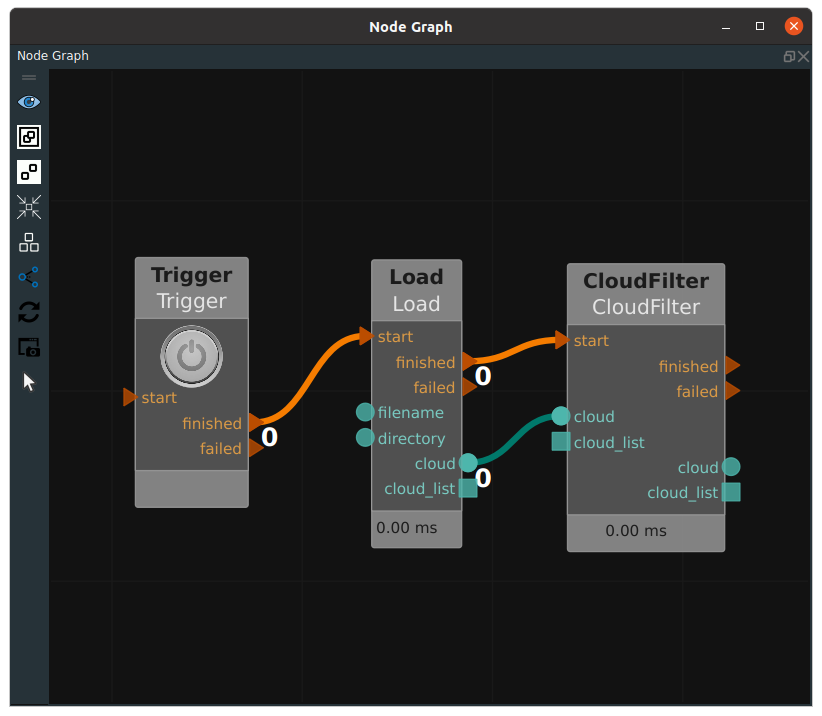
Sky blue ■ ● indicates the data signal port, ■ indicates the list data, ● is a single data.Data ports differ by data type,Common types include PointCloud, Image, String, Pose, Cube, and their respective list data such as CloudList, ImageList, etc.
Notes:Only data ports of the same type can be connected to each other. When different types of data signals are connected, a red error message is displayed in the log, indicating that the data signal port cannot be connected.
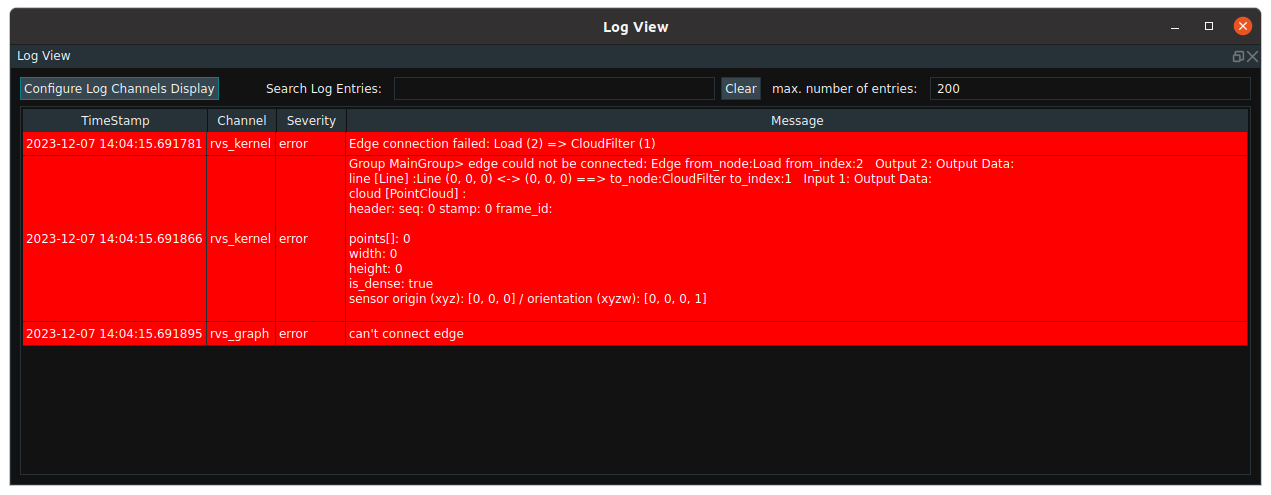
Notes:The data flow and signal flow can only flow backward and cannot form a loop. When you need to loop, use the MirrorInput and MirrorOutput ports of the Group. For details, see the Group Usage Guide
Connection skill
Operator line deleted/disabled
After selecting a connection, right click on the connection to bring up the menu bar.
 Delete:Delete the connection.Shortcut key:Delete。
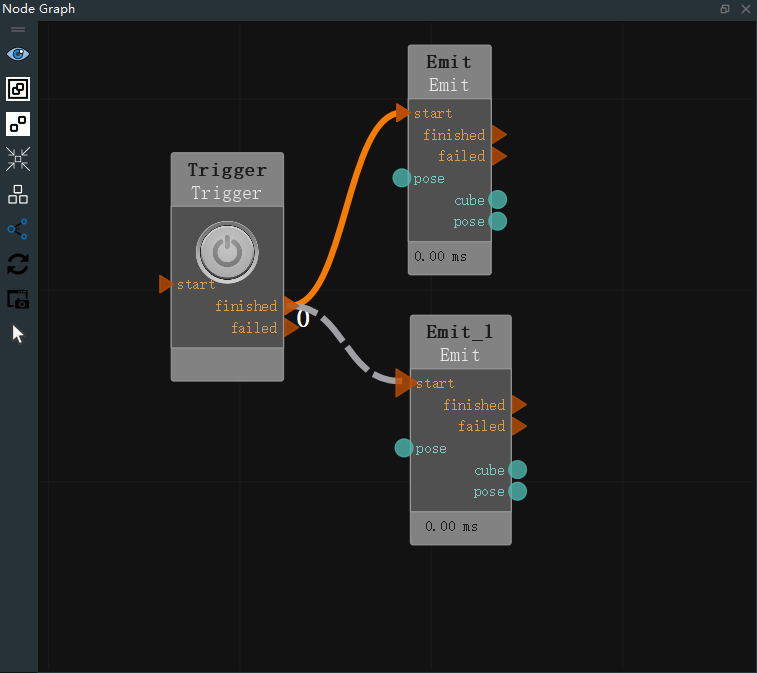
 Disable:Select the connection mouse right click, select
 Disablethe connection, disabled after the dotted line state. Select the connection again mouse right click, selectEnableto restore the connection.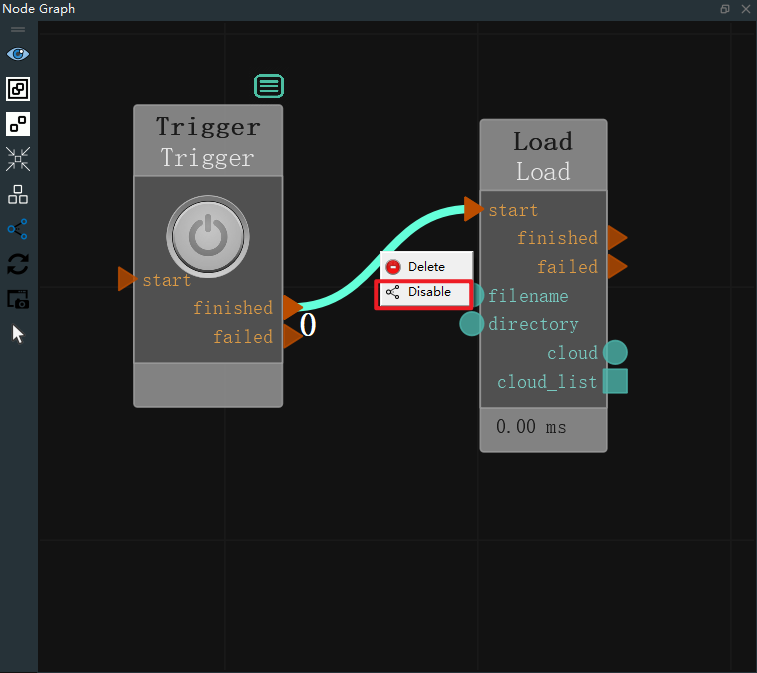
Change the port of the connection or change the node without having to delete an existing connection and re-establish a new one.Hold down Ctrl+ left key and drag to the desired position to release to change the connected port. Avoid zooming the view to find the node port, which is more convenient and fast.
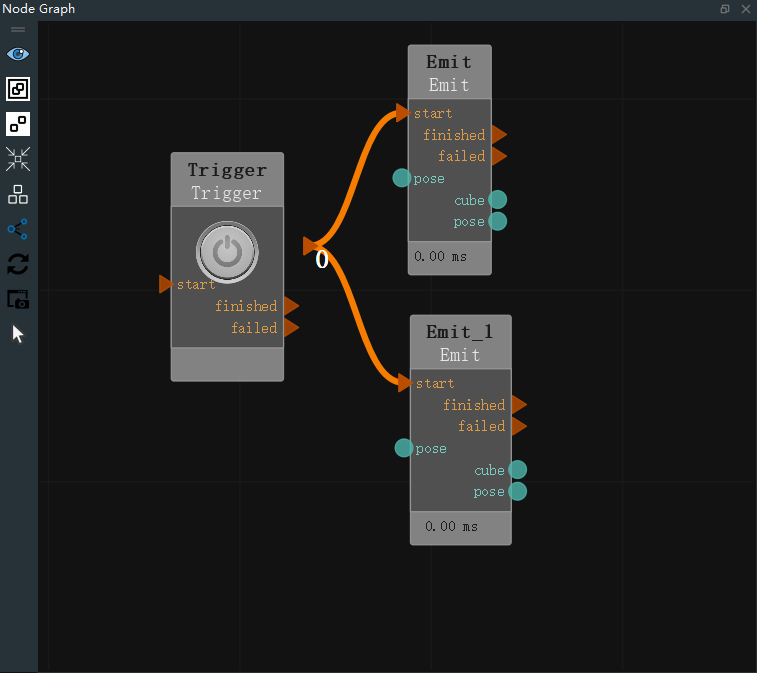
When you need to connect the same data type port node, hold down Alt+ left key drag to the same type port release to complete the operation. Avoid zooming the view to find the previous port, fast connection node.
Running node
Operator operation mode
There are two types of run nodes, single run and normal run.
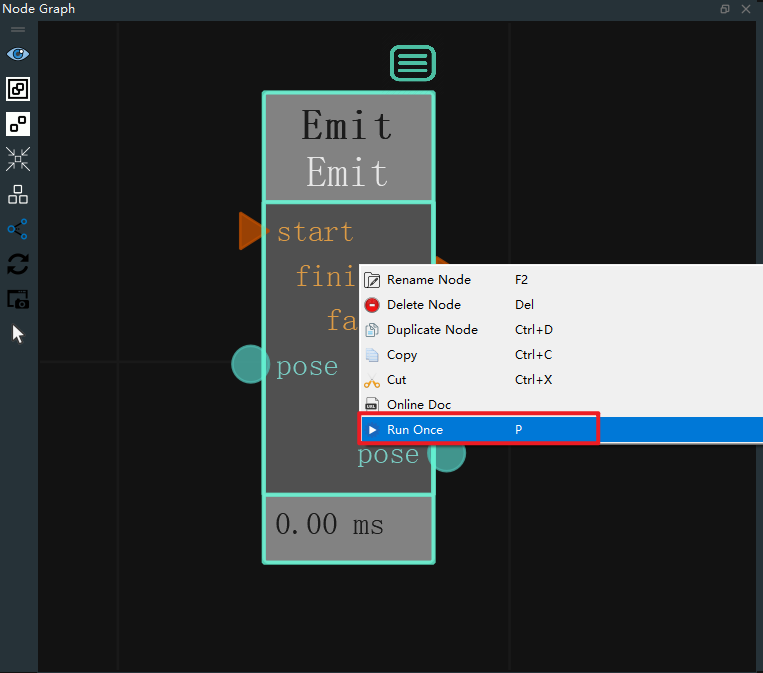
Run Once:When RVS does not run, right-click node, pop up the menu bar, select Run Once or shortcut key P, then the node runs once.
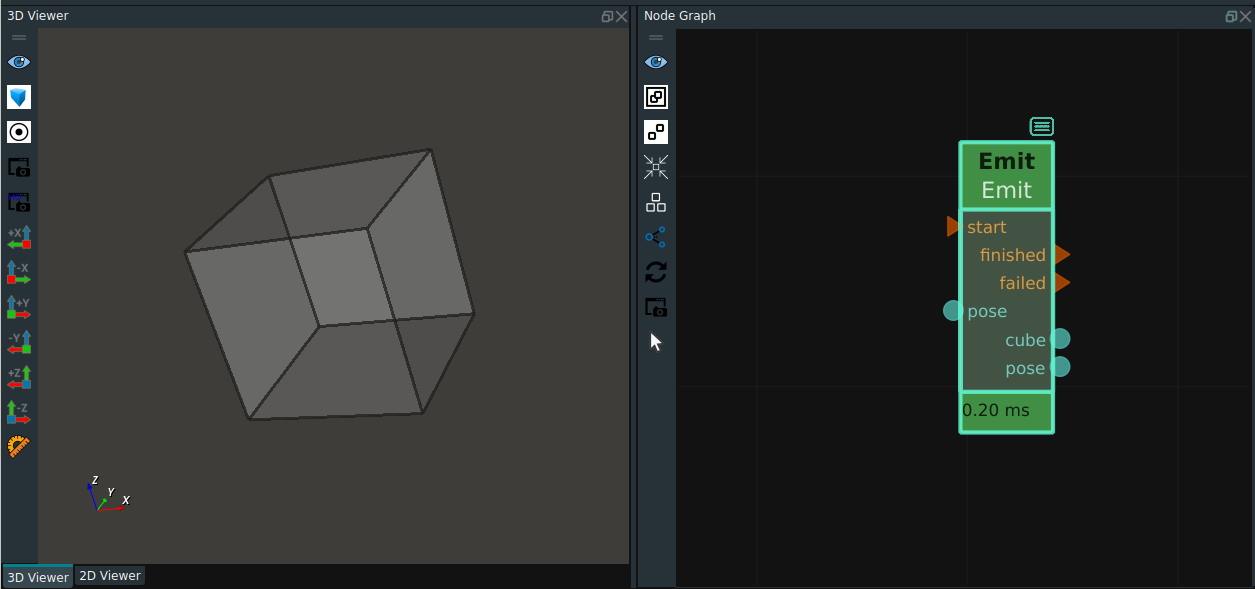
The node runs successfully as shown in the following picture.
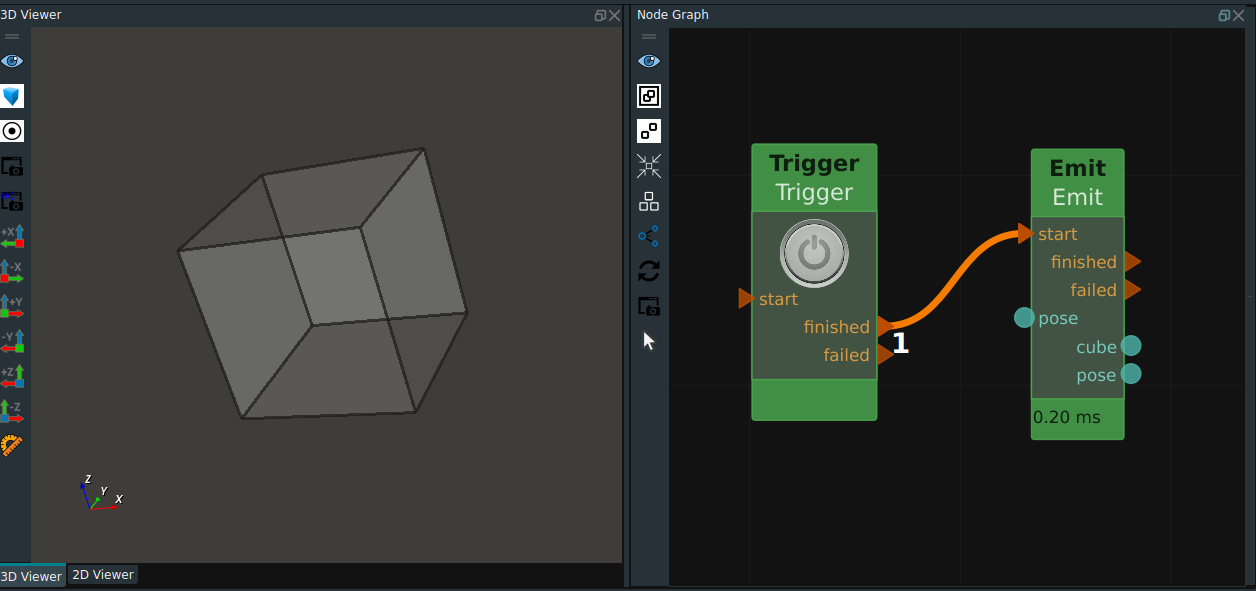
Run:Click the RVS Run button, click once to switch to running, click the Trigger node to trigger the subsequent node.
Notes:If both the filename attribute of the node and the filename port to the left of the node are assigned a value, the value of the filename port to the left of the node is preferred.
The node runs successfully as shown below.
Running status description
The node has 5 operating states, which can be distinguished by the color of the node:
gray:By default, the node is not triggered.
green:When the node is triggered and runs successfully, the finished port of the node sends a trigger signal.
blue:This node has been triggered and continues to run in a separate Thread, waiting for a reply, or is still in the process of computation, commonly seen in resource class nodes and thread class nodes whose names contain thread.
yellow:The node has been triggered, and the operation has completed, but the expected output result is not obtained, then the failed port of the node will give a trigger signal.
red:The node has been triggered, but a serious error has occurred and no trigger signal can be given.
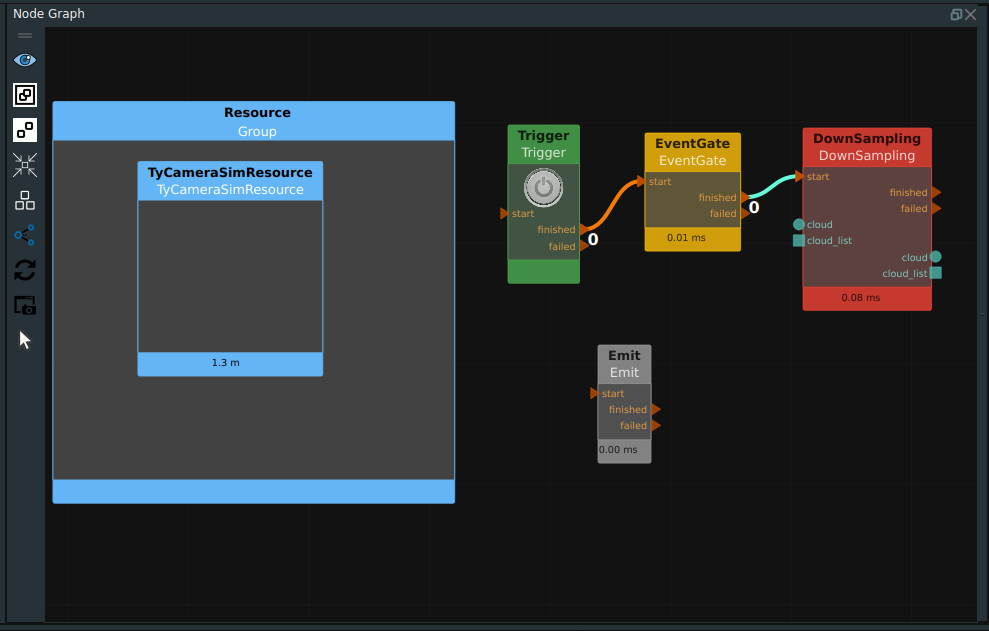
Running result interpretation
Operator data
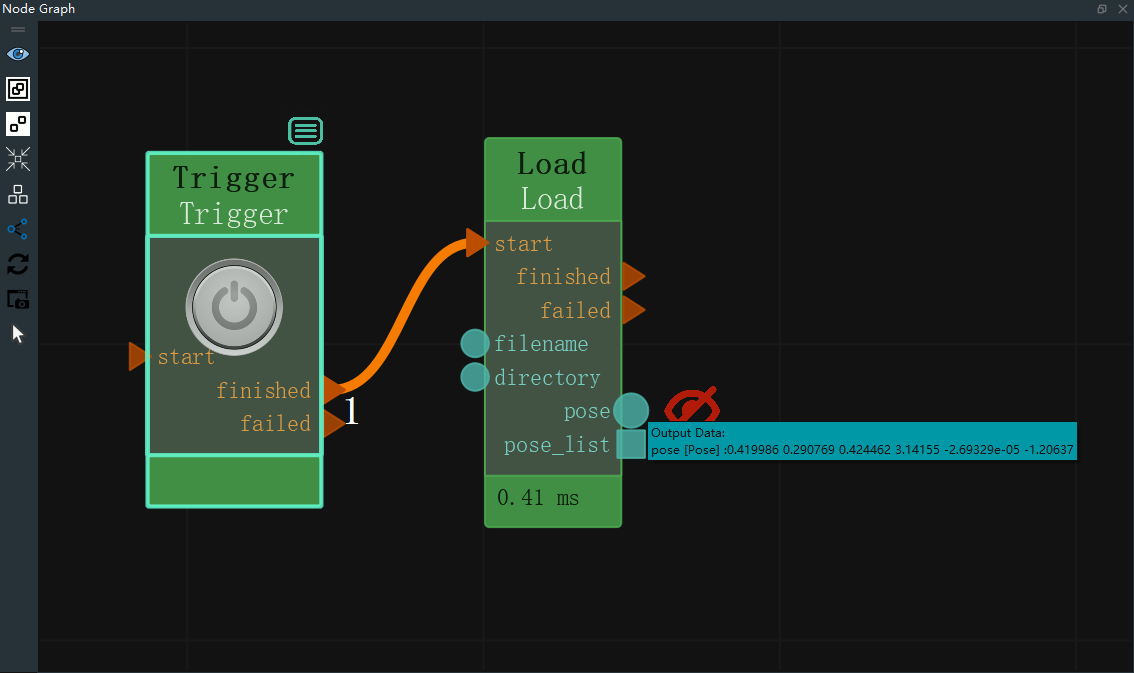
When the RVS program is running, if you need to view the actual data of a certain port of the node, you can move the mouse cursor to the corresponding port, and after 1 second of stagnation, the data information of the current port will automatically pop up, as shown in the following figure.
The type of the Load node in the following picture is Pose, and the output is pose[data type] : x y z roll pitch yaw.
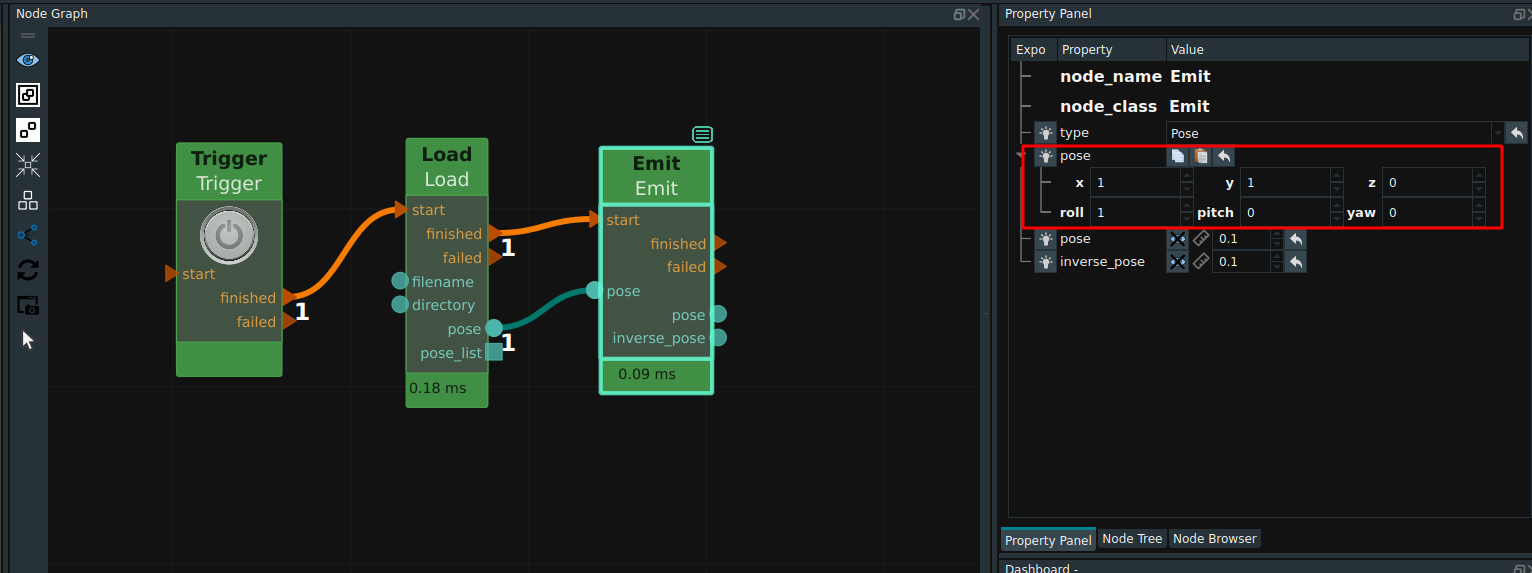
In addition, you can also view the operation result of the Emit node by connecting the output port to the input port of the Emit node with the same data type. Then you can view the actual value of the input data in the property bar of the Emit node. This method can also be more convenient to copy and paste data and other operations.
For nodes with data output ports, such as pointcloud ports, the property panel will have the corresponding visual properties  icon, you can turn this property on to display the results, turn it off to hide the display, which is hidden by default.

As shown in the picture above, for PointCloud type data output ports, in addition to containing ![]() color display properties, also contains
color display properties, also contains ![]() Point size attribute, unit: m, indicating the size of each display point.
Point size attribute, unit: m, indicating the size of each display point.
Notes:For point cloud output, if it is necessary to set the displayed point cloud color to the true color, the corresponding "color" attribute can be set to -2. In this case, as long as the point cloud data type is XYZRGB, the RGB data contained in it will be automatically used for color coloring and the true color information of the origin cloud will be restored. If the value is set to -1, the display color is randomly selected from 0 to 360 each time.
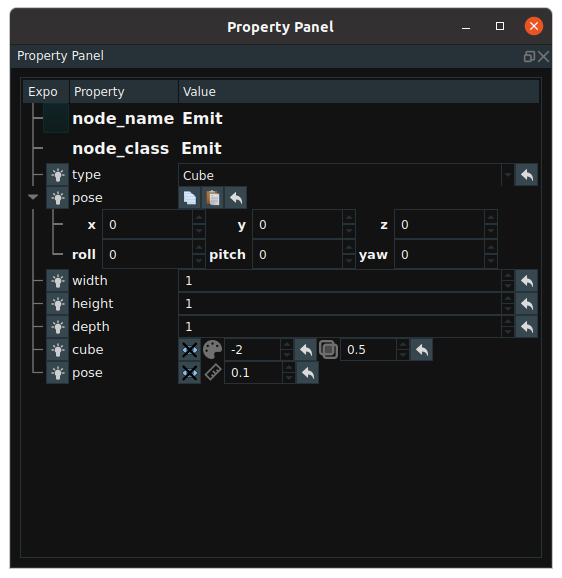
As shown in the picture above, for data output ports of type cube:
![]() :Indicates the color range between -2 and 360. In particular, 0 is red, 120 is green, and 240 is blue. The default value is -2.
:Indicates the color range between -2 and 360. In particular, 0 is red, 120 is green, and 240 is blue. The default value is -2.
![]() :Transparency: Range: 0 to 1, default value: 0.5.
:Transparency: Range: 0 to 1, default value: 0.5.
As shown in the figure above, for the pose data output port:
![]() :Represents the display length of the pose axis. Unit: m. Range: 0.001 to 10. Default value: 0.1.
:Represents the display length of the pose axis. Unit: m. Range: 0.001 to 10. Default value: 0.1.