Run Steps and View Outputs
This section introduces how to run steps and use the debug output feature to check the performance of the steps.
Run Steps
Run the Entire Project: Click
 in the project programming workspace to run the entire project.
Run a Single Step: Click
 on the step block to run the current step.
View Step Execution Time
After the step finishes running, its execution time is displayed on the step block.
View Debug Output
The Debug Output pane on the upper right of the home screen visualizes the step’s execution result. It helps you verify the output and debug the project.
About the Debug Output Pane
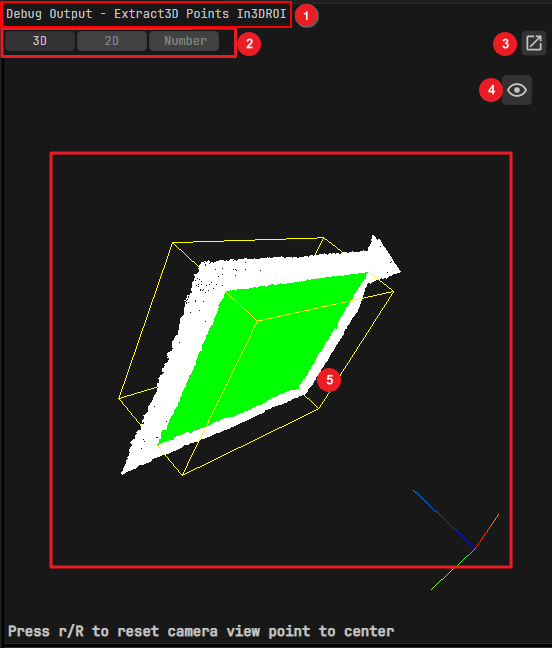
In the Debug Output pane, you can see:
The name of the step that the currently displayed debug output belongs to.
The data type of the output.
Click
 to detach this panel as an independent window for viewing.
Click
 to show or hide coordinate axes.
The visualized area of output results.
View the Output of a Single Step
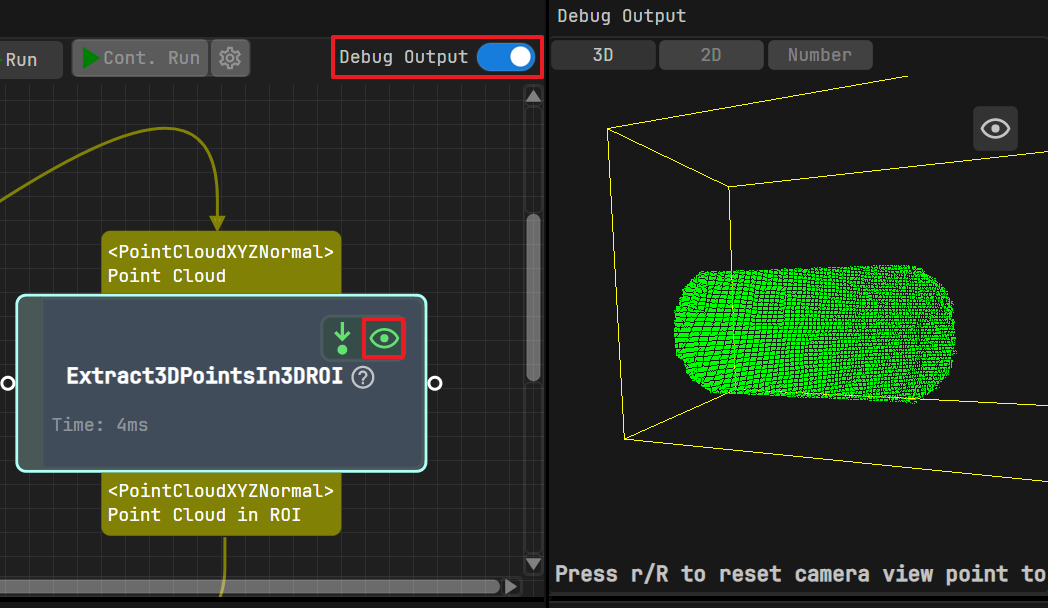
Enable  in the project programming workspace, and open the visual button
  in the upper right corner of the target step. After running the project, you can view the step execution results.
Adjust the View Angle
If the Debug Output pane displays 3D point cloud data, you can use the mouse to adjust the view angle:
Pan: Hover the mouse over the data area, right-click and drag.
Zoom In/Out: Scroll the mouse wheel up/down.
Rotate: Hover the mouse over the data area, left-click and drag.
Reset: Press R on the keyboard to reset to the default view.